One of the most difficult issues to get to grips with in Customer Experience is employee culture. Yet without gaining an understanding of where the blockages are in your organisation towards customer centricity your initiatives could end before they even begin. So how do you get to know, who believes in what? One way is to ask employees directly, but there is always the risk that in order not to feel that they are ‘being difficult’ they will say one thing but do another.
In a test piece of research, Beyond Philosophy undertook an analysis to see whether corporate perspectives on the Customer Experience could be teased out to see which employee cohort had similar beliefs to each other and which were separated from the group.
To do this we used specialist techniques from psychology that deep-dive into the subjective perspectives of the individual. This is very important in an employee context as the CEO clearly has a much stronger pull on decision-making than say a marketing executive.
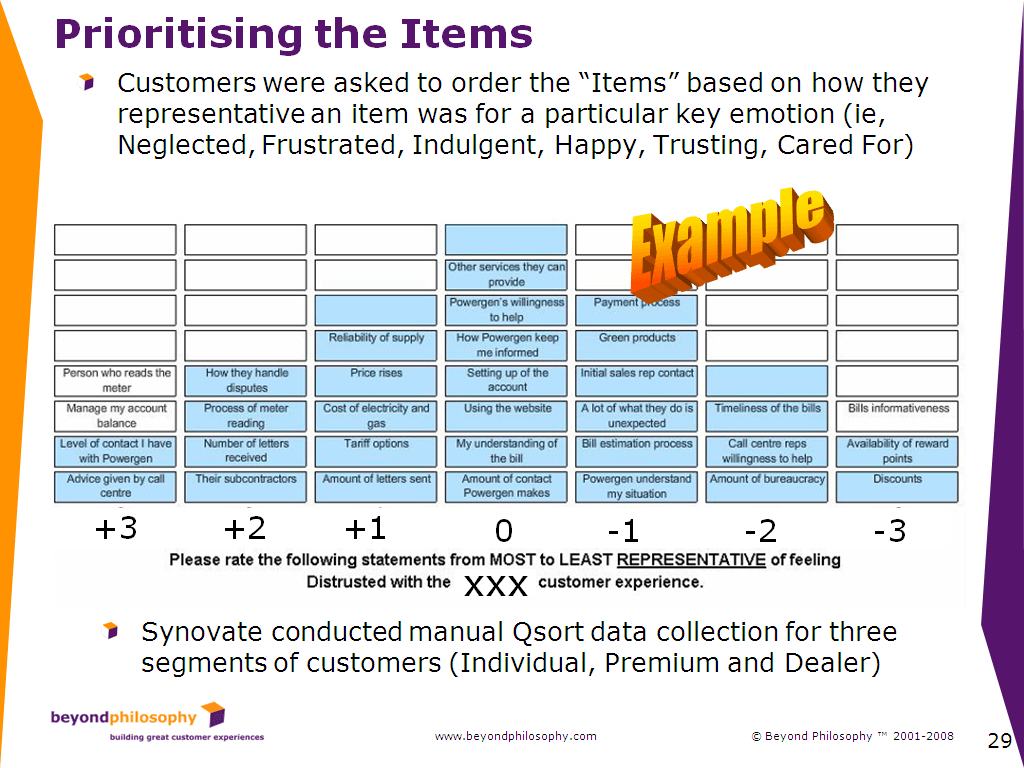
To execute our research we used a technique from psychology called Q-Methodology. Here we asked employees to order by importance 29 experience ideas developed by the board. Clearly the board had their own ideas of what they wanted to do, but they wanted to test whether this was consistent with broader employee views.
The following is an example of the approach:
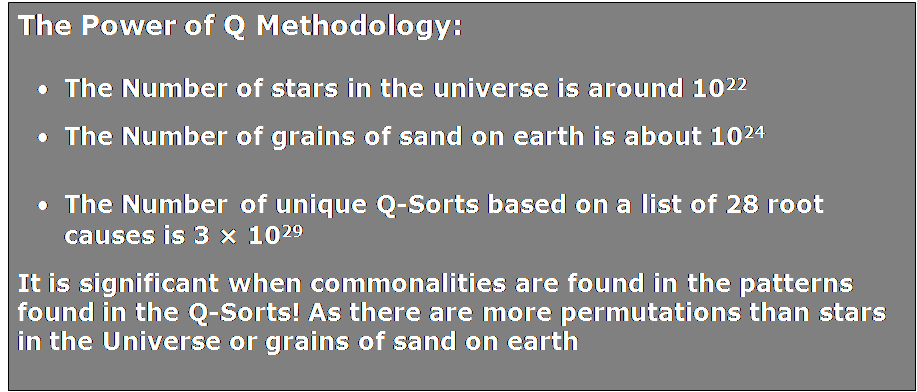
The extraordinary thing about this method is that because of the number of permutations of the above card sort, it only takes a small sample to determine if there is a significant pattern in the data. This enables a more granular level of analysis, by individual employee and department, than normally allowed for by other statistical methods. Hence, we can start to see how employees are similar or dissimilar in terms of mindset.
To illustrate this point, consider how if we used just 28 cards we would have the following number of permutations of card sorts.
Validation of the Method
Q Methodology maybe new to many readers, so here is a summary of statements on its use from Wikipedia:
Measuring the psychology of the individual
Q Methodology is a research method used in psychology and other social sciences to study people’s “subjectivity” — that is, their viewpoint. Q was developed by psychologist William Stephenson. It has been used both in clinical settings for assessing patients, as well as in research settings to examine how people think about a topic.
Measuring the psychology of the group culture
Q method supports Cultural consensus theory – a framework for the measurement and evaluation of beliefs as cultural; shared to some extent by a group of individuals.
Q method is different from traditional research techniques
Normal factor analysis, called “R method,” involves finding correlations between variables (say, height and age) across a sample of subjects. Q, on the other hand, looks for correlations between subjects across a sample of variables. Q factor analysis reduces the many individual viewpoints of the subjects down to a few “factors,” which represent shared ways of thinking. It is sometimes said that Q factor analysis is R factor analysis with the data table turned sideways.
One salient difference between Q and other social science research methodologies, such as surveys, is that it typically uses many fewer subjects. This can be a strength, as Q is sometimes used with a single subject.
Our results
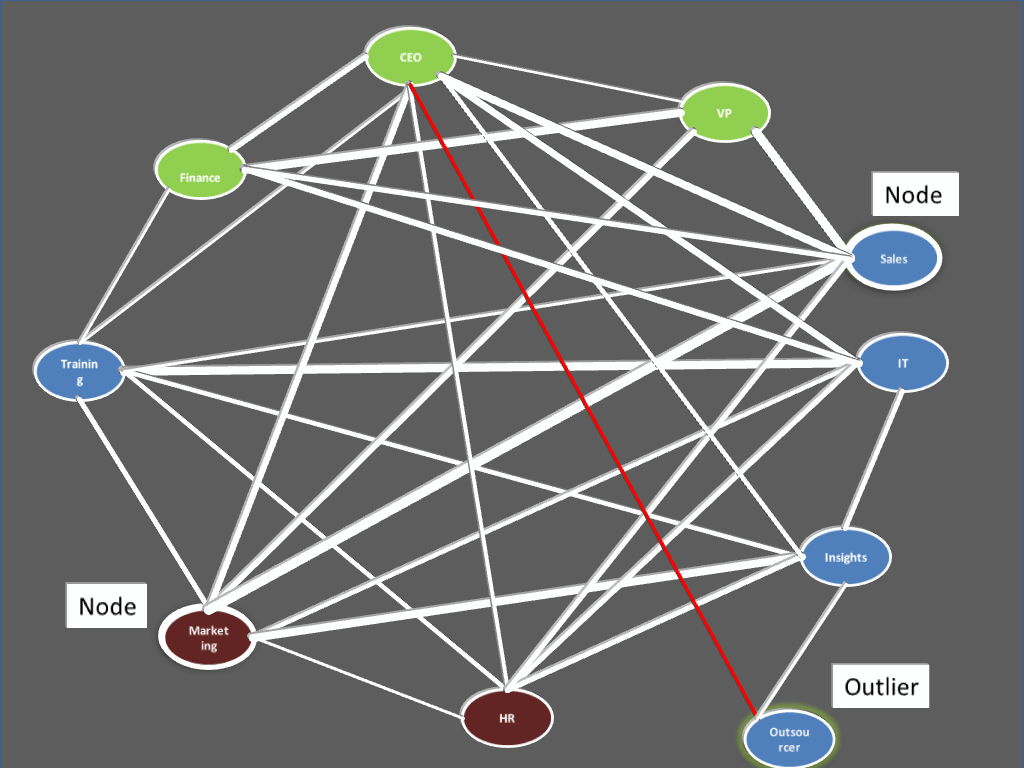
The Power Map below indicates from a research sample within one professional services firm how each cohort related: the strength of lines indicate the strength of agreement on what the company’s Customer Experience should be.
How Employee Cohorts relate
From the map above we can see that:
- The CEO’s mindset on the Customer Experience is only weakly related to the VP’s and Finance – this indicates some problems in future execution
- Outsource provider’s to the business have a completely different mindset and in fact hold an opposite view to the CEO – this will be a key barrier to overcome in any execution (these are the outliers)
- Sales and Marketing act as huge influencers in the business and are strongly in cahoots – without their support nothing will happen (they are both nodes)
- Insights is virtually ignored, except by Marketing
- IT seems oddly related to Training – perhaps there are friendship networks going on that may act as a barrier to action
Who is the most Networked?
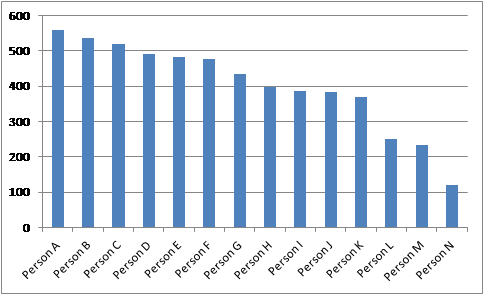
From the same data we can start also see which group or persons are most networked
And, how close or similar different people or employee groups are to certain key individuals. Here the distance in terms of similarity of perspectives towards the Customer Experience is shortest between person A and B.
Power Maps are quick to perform – taking around 10 minutes for employees to complete online or face to face. They reveal deep and rich data that can help a business understand the power relationships in a business and what actions need to be performed to get buy-in for any initiative.
| Steven Walden is VP Consulting and Thought-Leadership for Beyond Philosophy. Steven has 17 years Strategy Consultancy experience directing and designing strategies for major B2C & B2B firms. At Beyond Philosophy, the Global Customer Experience Consultancy, he is a Thought Leader and Innovator, directing engagements to assist leading firms to transform through Customer Experience. A world-leader in emotional experience his skills lie in innovation, thought-leadership, strategy consultancy and Qual/ Quant research. He is a regular speaker at conferences, blog writer, CE Trainer and international author. |


